Guide
One retirement plan, three ways to model the market
Compare rolling history, random past years, and the market model used by When You Stop, with the same plan inputs and clear limits.
The short answer
The same retirement plan can get different results depending on how we model the market. We tested three methods through our engine, with the same plan inputs.
Savings paid for all 30 years of spending in 94.2% of past periods kept in order. The rate was 91.2% when we picked past years at random, and 77.4% with the market model used by When You Stop. Each random-method rate combines five runs of 1,000 paths. The historical rate covers 69 past periods.
These are results for a fee-free test plan, not your retirement odds or a ranking of model quality. The third method uses our current market settings, but not the full product's taxes, fees, benefits, or lifespan rules. The SEC explains why past results and back-tests are not forecasts.
Three ways to build a path
A path is one possible set of market years in a chosen order. Here is how each method builds one.
Keep past years in order
Start with 1928 and follow the next 30 years, through 1957. Then move the start to 1929 and follow through 1958. Keep going until the last full period, 1996 through 2025.
This is a rolling window. It keeps the good and bad years in their real order. Our 98 years of data give us 69 full windows. Most windows share many of the same years. They are not 69 separate sets of evidence.
Pick years at random
Think of each past year as a card. It holds that year's stock return, bond return, and change in prices. Draw one card, record it, and put it back. Draw again until you have 30 years.
This is a bootstrap test. A year can show up twice or not at all. The stock, bond, and price data stay together on each card. The order of the cards changes.
We repeat this 1,000 times for each run. A number called a seed controls the draw, so we can repeat the same test.
Use our current market model
The engine-backed When You Stop tool uses a parametric model. That means we set rules for returns, then draw new values from those rules. It does not draw cards from past years.
The rules use a bell-shaped spread of possible returns. Stocks have a 5% average yearly return above inflation and an 18% spread. Bonds use 2% and 6%. Price changes use a 2.5% average rise and a 1% spread.
That spread is called standard deviation. It sets how widely draws vary around the average; it is not a best-case or worst-case limit. Stocks, bonds, and price changes are drawn separately, with fresh draws each year.
We read these settings from the app's current code for this test. We did not tune them to make the results match the historical tests.
Our return rules differ from the past sample
The current model assumes lower stock returns, not lower returns for both assets. Its bond average is slightly higher than the average in our stored history.
| Measure | 1928–2025 sample | Current model |
|---|---|---|
| Stock average | 8.61% | 5.00% |
| Bond average | 1.83% | 2.00% |
| Stock spread | 19.20% | 18.00% |
| Bond spread | 8.81% | 6.00% |
These averages are above inflation and before fees. We first adjust each past year's return for that year's price change, then take a simple average of the 98 years. This is not the compound growth rate earned over the full period. Spreads use all 98 years as the sample to draw from.
At a 60/40 mix, those asset averages imply a yearly real return of about 5.90% for the past sample versus 3.80% for the current model. These are averages before spending and fees, not a safe spending rate. The inputs and exact figures are in the run details.
| Method | How it builds years | What it leaves out |
|---|---|---|
| History in order | Keep actual past years in their real order. | Other orders and events outside the stored history. |
| Random past years | Pick each past year's stock, bond, and price data as one unit. | Links between one year and the next. |
| Current market model | Draw new stock, bond, and price changes from set rules. | Links across years and between the separate draws; a bell shape can miss extreme events. |
What we held the same
We used a simple test plan, not a full household budget.
| Input | Value or rule |
|---|---|
| Starting savings | $1,000,000. |
| Investment mix | 60% stocks and 40% bonds; reset to that mix each year. |
| Time span | 30 years. |
| Spending | $40,000 in year one; then adjusted for each path's price changes. |
| Timing | Take out the year's spending before that year's return. |
| Not included | Taxes, fees, Social Security, added health costs, and changes in lifespan. |
The $40,000 is 4% of starting savings. It is not 4% of the new balance each year. We adjust that spending for price changes to keep buying power steady. BLS explains this use of constant dollars.
We kept the original fee-free benchmark so the three methods share one cost rule. The full product applies a 0.4% yearly investment fee; this test removes that fee from the current market model too. It is not a full product run.
The two historical methods use 1928–2025 U.S. stock returns, 10-year Treasury bond returns, and inflation. The stored data came from Aswath Damodaran at NYU Stern. Our source notes record a May 31, 2026 download. We used that stored copy, not a fresh download of a source that may change. The run details include its file fingerprint.
The third method uses the market settings above, not that historical data set. So this comparison changes the market rules and return assumptions. It does not isolate the effect of changing year order alone.
What the test found
A path passes only if it pays the full spending target in every year. Ending with some money is not enough if an earlier year fell short.
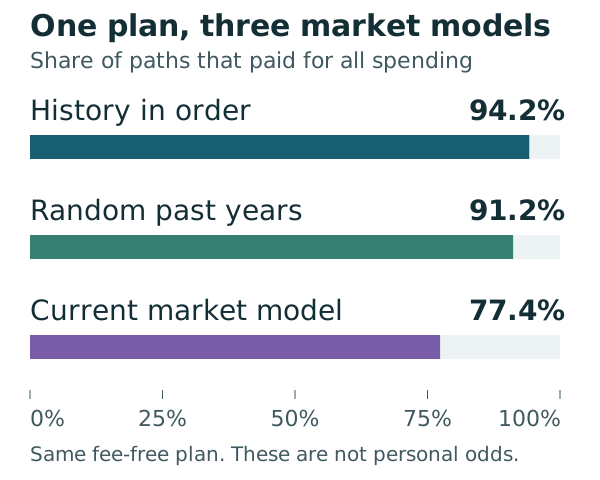
| Market method | Paths that passed | Paths tested | Share that passed |
|---|---|---|---|
| History in order | 65 | 69 | 94.2% |
| Random past years | 4558 | 5000 | 91.2% |
| Current market model | 3869 | 5000 | 77.4% |
For each random method, we add the paths that passed across all five runs, then divide by 5,000. Those combined rates are not new forecasts. The five runs use the same plan and the same model rules.
Every random run, not just a chosen example
We kept the same five seeds from the earlier test note, chosen before this comparison. Each entry below is out of 1,000 paths. Matching seed numbers do not mean that the two methods drew matching market years.
| Seed | Past years: passed | Past years: rate | Current model: passed | Current model: rate |
|---|---|---|---|---|
| 20260530 | 905 | 90.5% | 768 | 76.8% |
| 1 | 905 | 90.5% | 775 | 77.5% |
| 2 | 922 | 92.2% | 794 | 79.4% |
| 3 | 916 | 91.6% | 775 | 77.5% |
| 424242 | 910 | 91.0% | 757 | 75.7% |
The random-past-year rates range from 90.5% to 92.2%. The current-model rates range from 75.7% to 79.4%. These ranges describe these five runs only. They are not confidence intervals or upper and lower bounds for your plan.
Why the results can differ
Bad years early in retirement can hurt more than bad years late in retirement. Spending after a loss leaves less money to take part in a later recovery. This is often called sequence risk: the risk that years arrive in a harmful order.
Keeping history in order keeps each crash next to the years that followed it. Picking years at random can group losses that never happened back to back. It can also group good years or break up a long rough spell.
Our current model also changes the assumed averages, the spread of returns, and the links between stocks, bonds, and prices. The three bars alone do not separate those effects. We ran an extra check below to see what changes when we match some of the assumptions.
A lower success rate is not proof of a more accurate model. Nor is a higher rate proof of a safer plan. Different inputs or market rules can change the result.
What about links between years?
That is a fair concern. Both random methods here lose links between consecutive years. Rolling windows keep actual sequences, but cannot show events outside the past periods we have.
Even the two historical tests do more than change the order. The rolling windows overlap, and years near the ends of the data appear in fewer windows. Random draws give each stored year the same chance on each draw. We should not treat the gap as a clean measure of year-to-year dependence.
The updated engine also supports blocks of past years. It follows several years in order, then jumps to a new start. The block length varies at random. Our extra check uses blocks that average five years. At the end of the stored data, a block wraps to the first year. That join is not real history.
Blocks keep some links between nearby years, but the five-year choice is a test setting, not a proven rule for future markets. The engine can also link stock and bond draws within a year. The current app has not switched to either option. Its stock and bond draws still have no set link, and each year's draws are fresh.
What if we give history the same return rules?
We made two changed copies of the stored data. These are made-up test data, not actual past returns.
- Match averages only: shift stock returns to a 5% real average and bonds to 2%. Keep the past spread and price changes.
- Match averages and spreads: use those same averages, then change the stock spread to 18% and the bond spread to 6%. Also match the model's price-change average and spread.
Each change keeps the years in order and keeps the shape of each series. It shifts or stretches the values, not the dates. Links between the series stay in place. We do not change the original data file or the app's settings.
We then reran the same fee-free plan. Each random case uses 10,000 paths with seed 20260905. Within each random method, all three data versions use the same drawn year order. Rolling cases use the same 69 start dates. This is a separate check from the five-run chart above.
| Path method | Past returns | Match averages only | Match averages and spreads |
|---|---|---|---|
| Random past years | 9078/10000 (90.78%) | 7186/10000 (71.86%) | 7522/10000 (75.22%) |
| Five-year blocks | 9280/10000 (92.80%) | 7421/10000 (74.21%) | 7809/10000 (78.09%) |
| History in order | 65/69 (94.20%) | 48/69 (69.57%) | 50/69 (72.46%) |
With the same plan, seed, and 10,000 paths, our current market model passes 7750/10000 (77.50%). It does not use the changed history.
Matching both averages and spreads brings the five-year-block result to 78.09%, close to the current model's 77.50%. This repeats the earlier five-year-block finding on the updated engine. But matching averages alone gives 74.21%, not 78.09%. The earlier test changed more than the average return.
Return assumptions explain much of the gap in this test. The large cut to the stock average matters; the bond average rises slightly. Changing the spread matters too. This check does not split out each asset's effect on its own.
The methods do not become the same. Even after matching averages and spreads, random single years give 75.22% and rolling windows give 72.46%. Year order, how often each year is used, and the shape of returns still differ. A near match in one case is not proof that two models agree in general.
We also changed price data in the averages-and-spreads test. For this tax-free plan with fixed buying power, price changes cancel out of the real-dollar math. That does not hold for every plan with taxes or benefits.
The extra CSV and run details include all ten cases, not just the close match. These results use one seed per random case. They do not prove equal models or the right odds for the future. We chose the one-year and five-year checks before running them; we did not search for a block length that would match our model.
Why not rely on past returns alone?
History shows what happened, not what must happen next. Both historical methods use the years in our stored data. They cannot draw a new kind of year that is missing from that record. More draws do not fix that limit. The SEC cautions against treating past or back-tested results as a forecast.
A model with different return assumptions lets us ask another question: what if future returns have a different average or spread? That is a reason to test other models, not a reason to ignore history. We can use history as one check and test other assumptions alongside it.
Our current model can draw values outside the stored past returns. But its bell shape and separate yearly draws still leave out risks and links. Being different from history does not make it a better forecast.
This test does not establish that our 5% stock and 2% bond real-return averages are the right forecast. The new assumptions record labels them as provisional, with no independent forecast basis yet established. They came from the existing product settings. A stronger case needs clear source evidence, a date for the estimates, and tests of other plausible values. We should not choose settings just to reach a target success rate.
The useful question is whether a plan still works under a range of well-explained assumptions—not which model gives the most pleasing number.
What this does not prove
- None of these methods knows which market years will come next.
- A past U.S. data set cannot include every future shock or every country's experience.
- More random paths do not create more years of real market history.
- The five-run ranges are not confidence intervals. They do not give upper and lower bounds for your result.
- Leaving out taxes and fees makes this unlike a full retirement plan.
- The test does not prove that one tool is more accurate than another.
How to check our work
We reran all three methods and the adjusted-history checks on September 11, 2026, with engine version 0.15.0 and result format m16.0. The CSV downloads hold the three-method summary, each run's counts, and the extra checks. The run details file holds the shared inputs, each market model's settings, seeds, data and code fingerprints, and each past window's result. It also records the fee we removed from the product settings and the exact rule used to adjust history.
The full engine is not public. These files let you check the reported counts and inputs, but do not make this a complete outside audit.
Our separate cFIREsim benchmark checks the rolling-history path against a recorded external result. It does not validate the current market model's settings. We did not rerun cFIREsim for this guide, and its recorded test used a different historical date range. It is not a fourth result in this controlled comparison.
Version 0.2 compared the two historical methods. Version 0.3 added our current market model. Version 0.4 reran the tests on the updated engine and added the return-assumption checks. Version 1.0 is the reviewed publication edition; the measured results are unchanged. The page keeps its original URL so existing links still work.
For the separate question of yearly taxes, health costs, and account balances, read how we check retirement math. For the wider picture, read how our calculations work, then explore When You Stop. The tool uses the third market model, with fees and household details such as taxes and lifespan. The rates in this guide are not the rates the tool will give you.
This guide is for learning, not financial advice.
Sources and notes
Downloads
Cite this guide
Tom Brancato. “One retirement plan, three ways to model the market.” Whatify Money. Version 1.0. Updated September 7, 2026. https://whatify.money/guides/bootstrap-vs-rolling-windows